The CPS Annual Regional Analysis (ARA) is a collection of reports that have been created to support conversations with communities and stakeholders. These reports provide data that helps answer questions about who attends CPS schools, where do students enroll, what programs do CPS schools offer, and is the district meeting family and community needs.
Updated yearly, the ARA presents CPS data in one place and does not make recommendations or suggestions for action. Instead, these reports are designed to empower stakeholders with the information they need to ask questions and advocate for the types of schools they want in their communities. In doing so, the ARA supports CPS's goal of ensuring that every student in every neighborhood receives a high-quality education.
Stakeholders are encouraged to review this information to understand current school quality, enrollment patterns, school choice options, and program offerings at the district level and across the 16 Chicago regions.
Structure & Organization
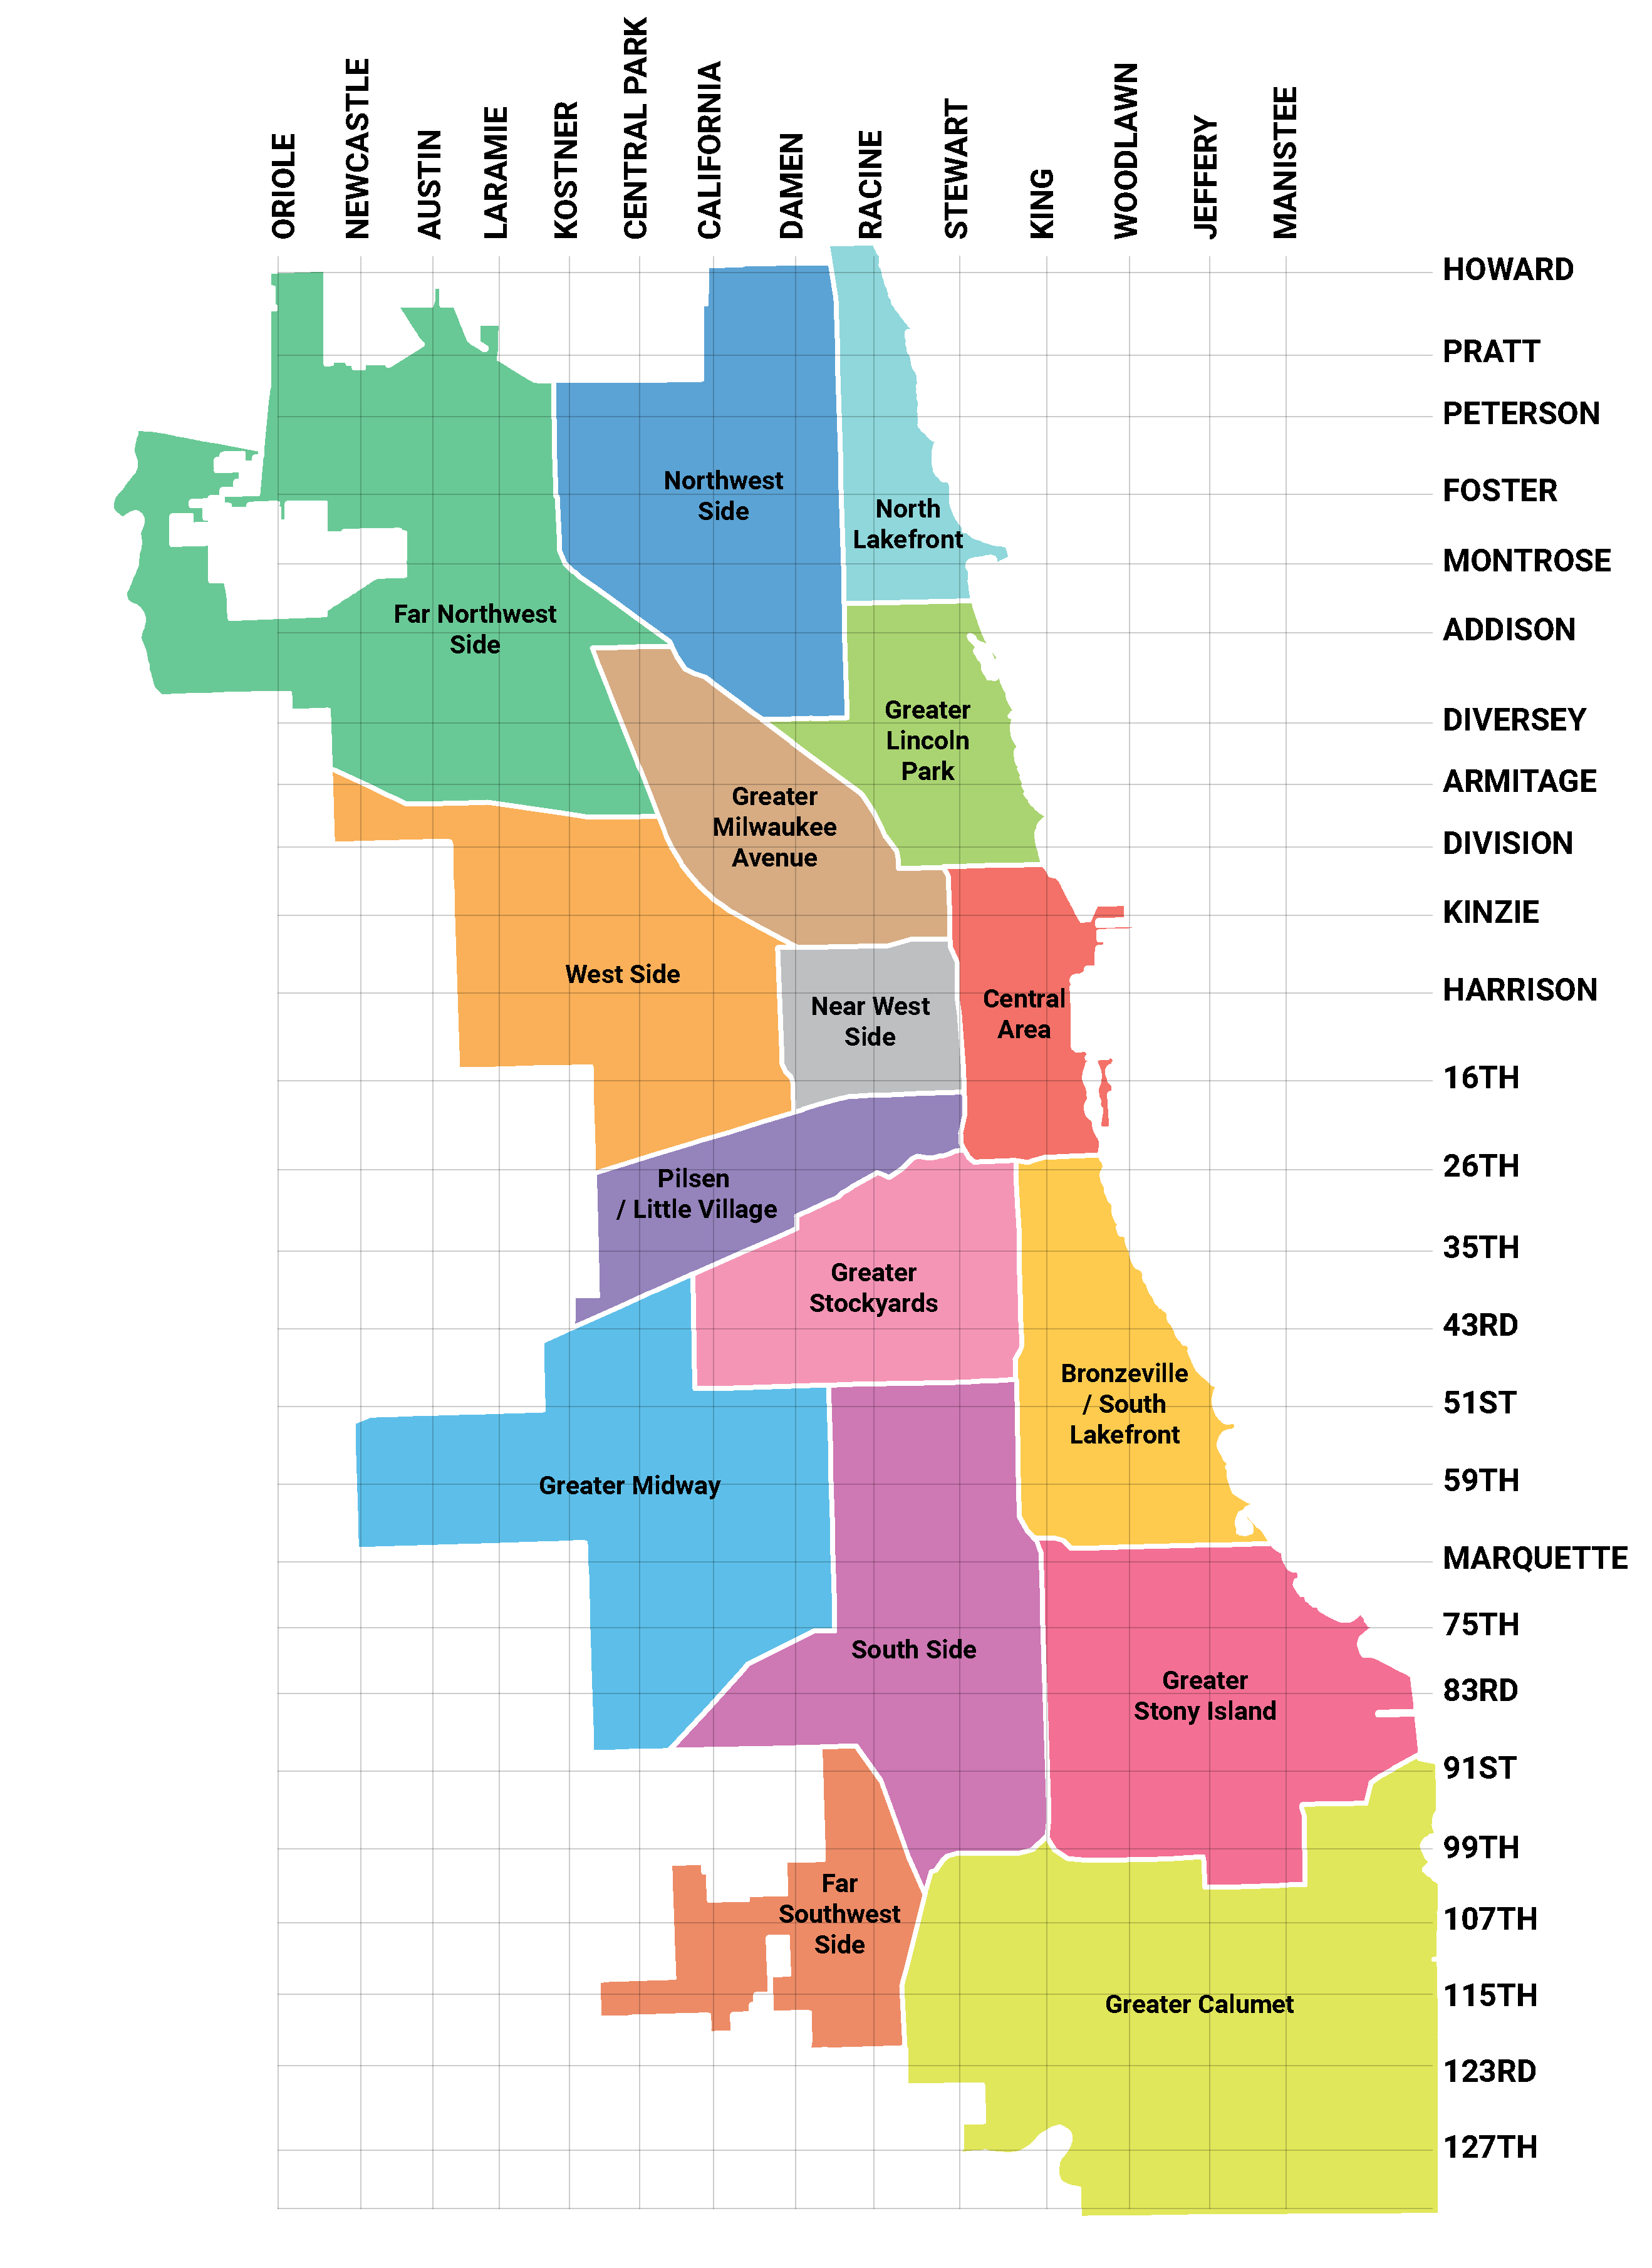
The ARA consists of a district report and 16 regional reports. The City of Chicago Department of Planning and Development created boundaries for regions based on housing and employment research. Natural borders such as rivers and train lines divide each region. These borders are likely considerations for families when selecting a school. The ARA uses these regions since they are more consistent than city wards or school networks.
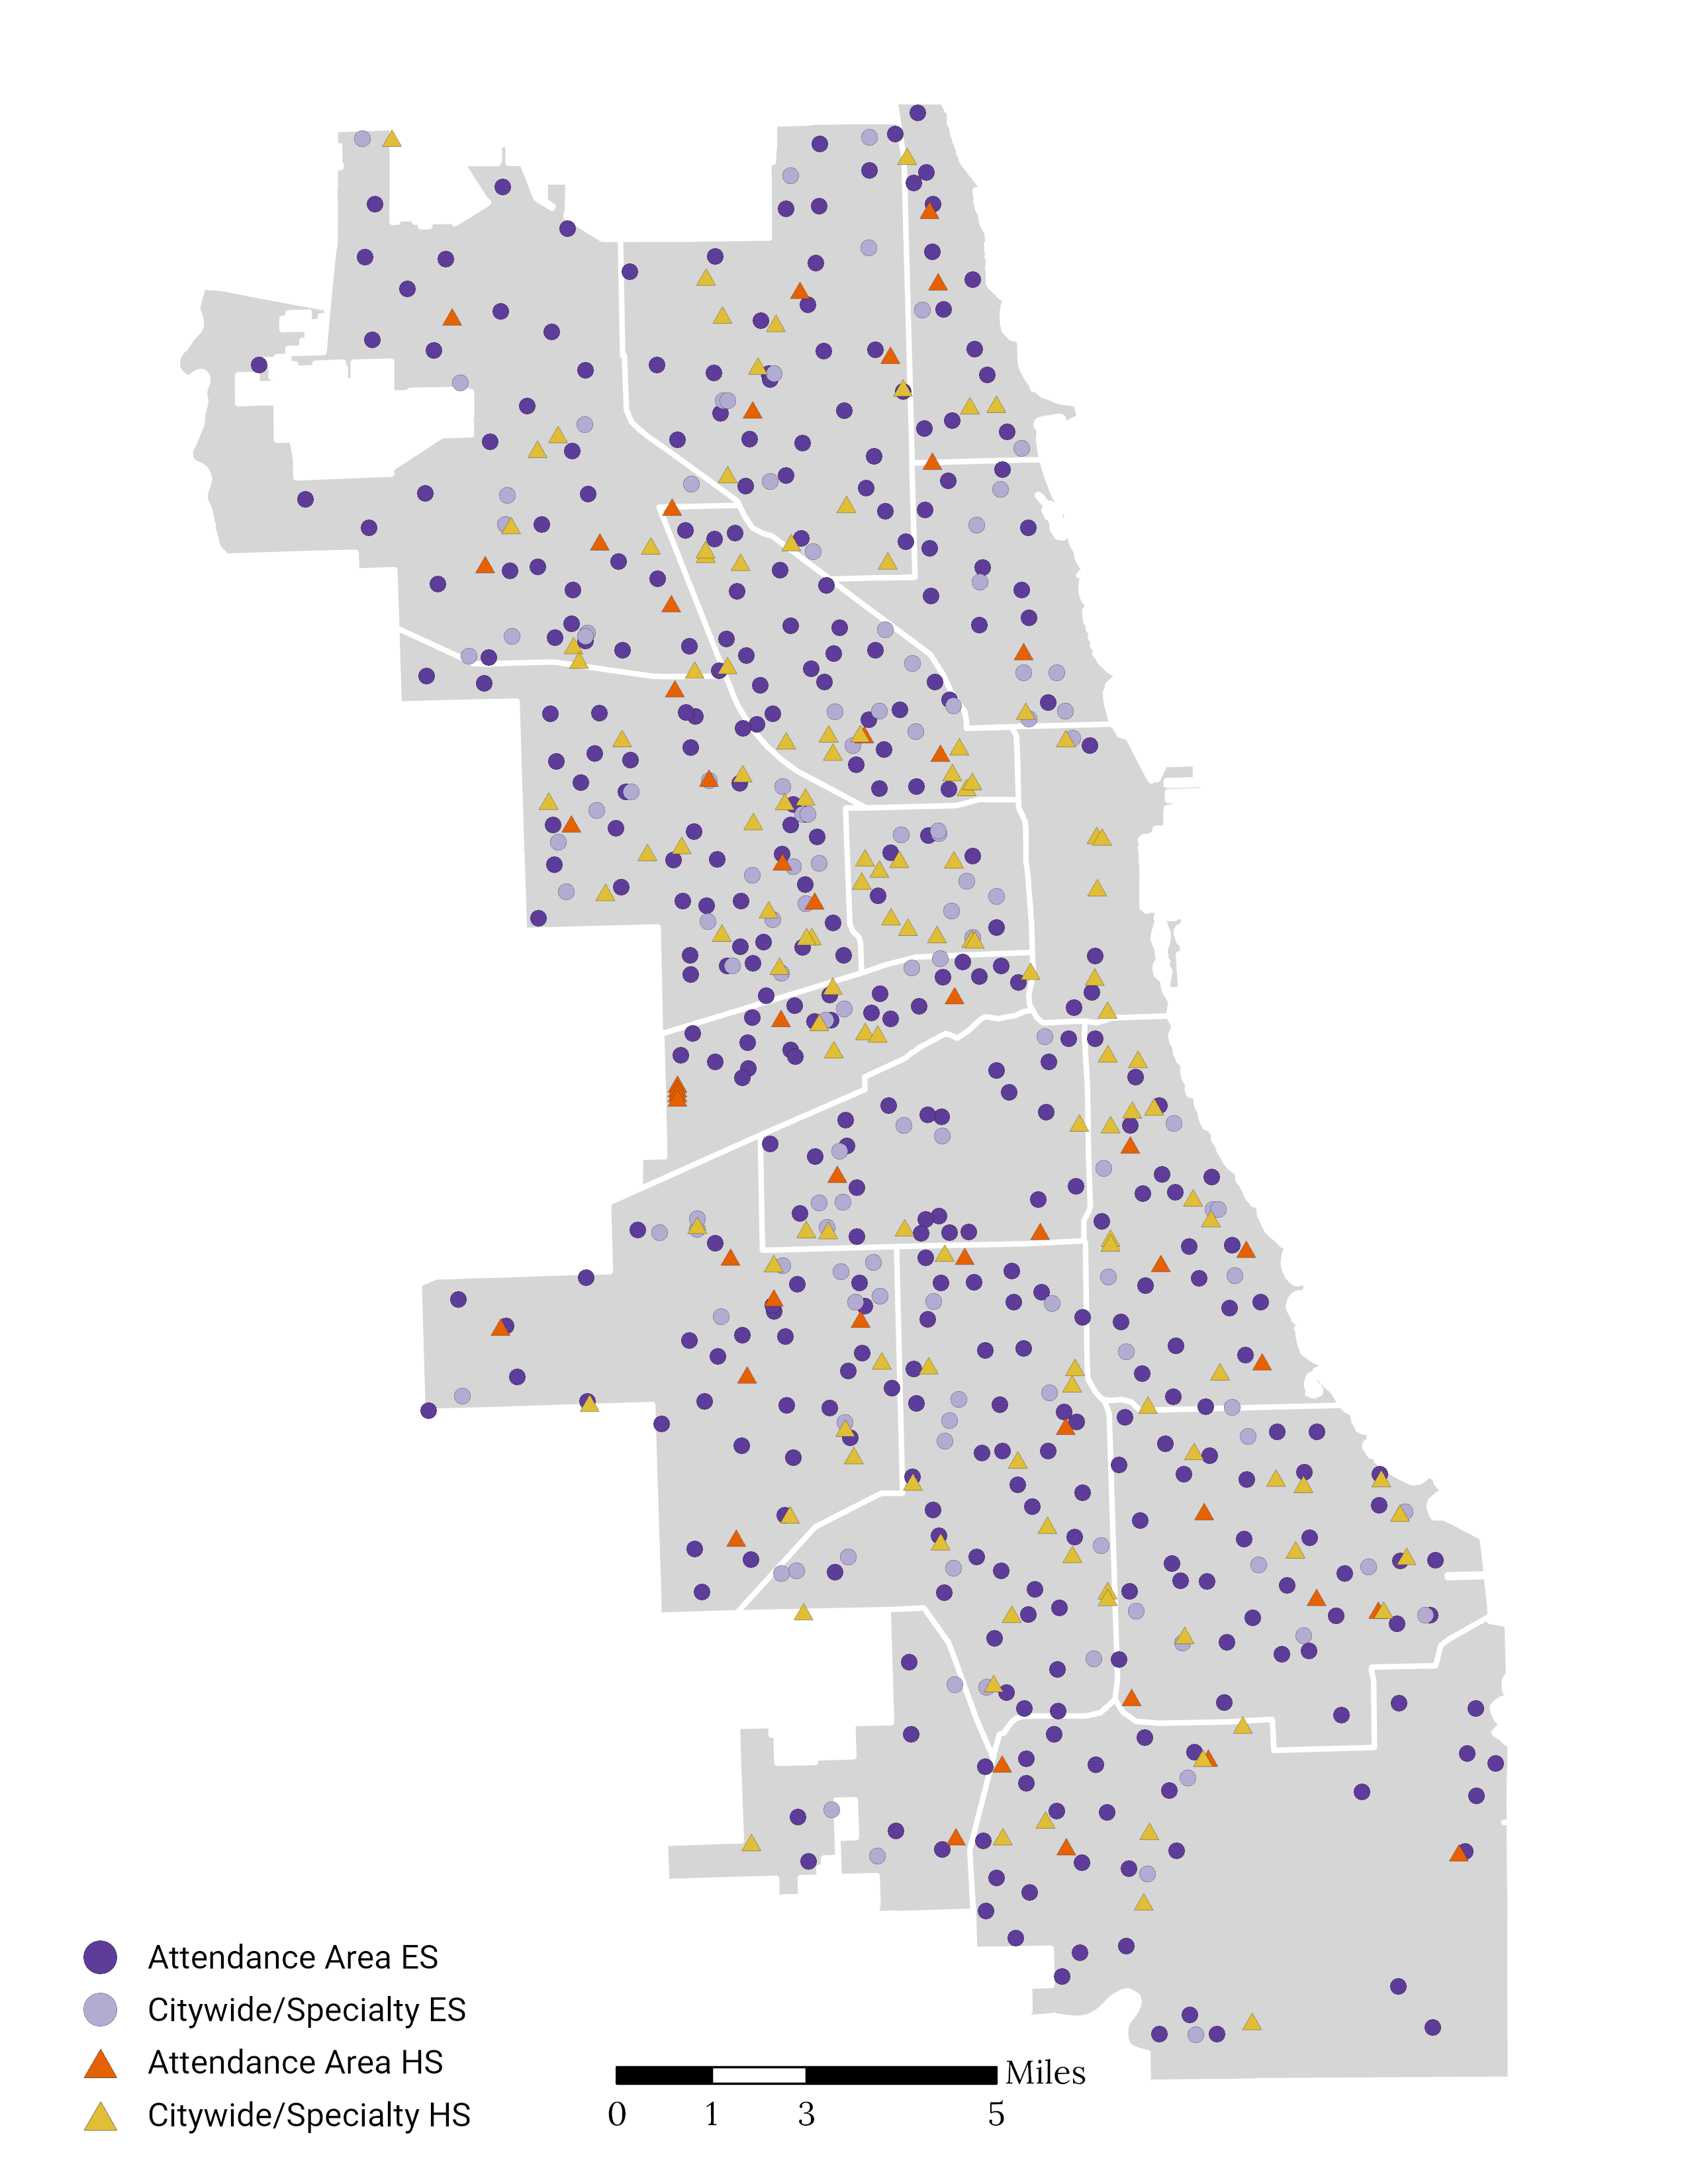
The ARA includes all CPS schools, including traditional neighborhood schools, Charter schools, Selective Enrollment, Magnet, Special Education, Specialty, and Options High Schools.
Demographic Composition
The racial/ethnic and socioeconomic composition of CPS has remained relatively the same since the 2020-21 school year.
Racial/Ethnic Composition
Over the past four years, the proportion of students from all racial/ethnic backgrounds has remained relatively the same. However, the population of students identifying as Latinx has decreased by 7,559 students, the population of students identifying as Black has decreased by 8,919 students, and the population of students identifying as White has decreased by 1,348.
| District-wide, student enrollment has declined by more than 17,000 students since the 2020-21 school year.
Race/Ethnicity Composition Over Time
Race/Ethnicity Composition Over Time
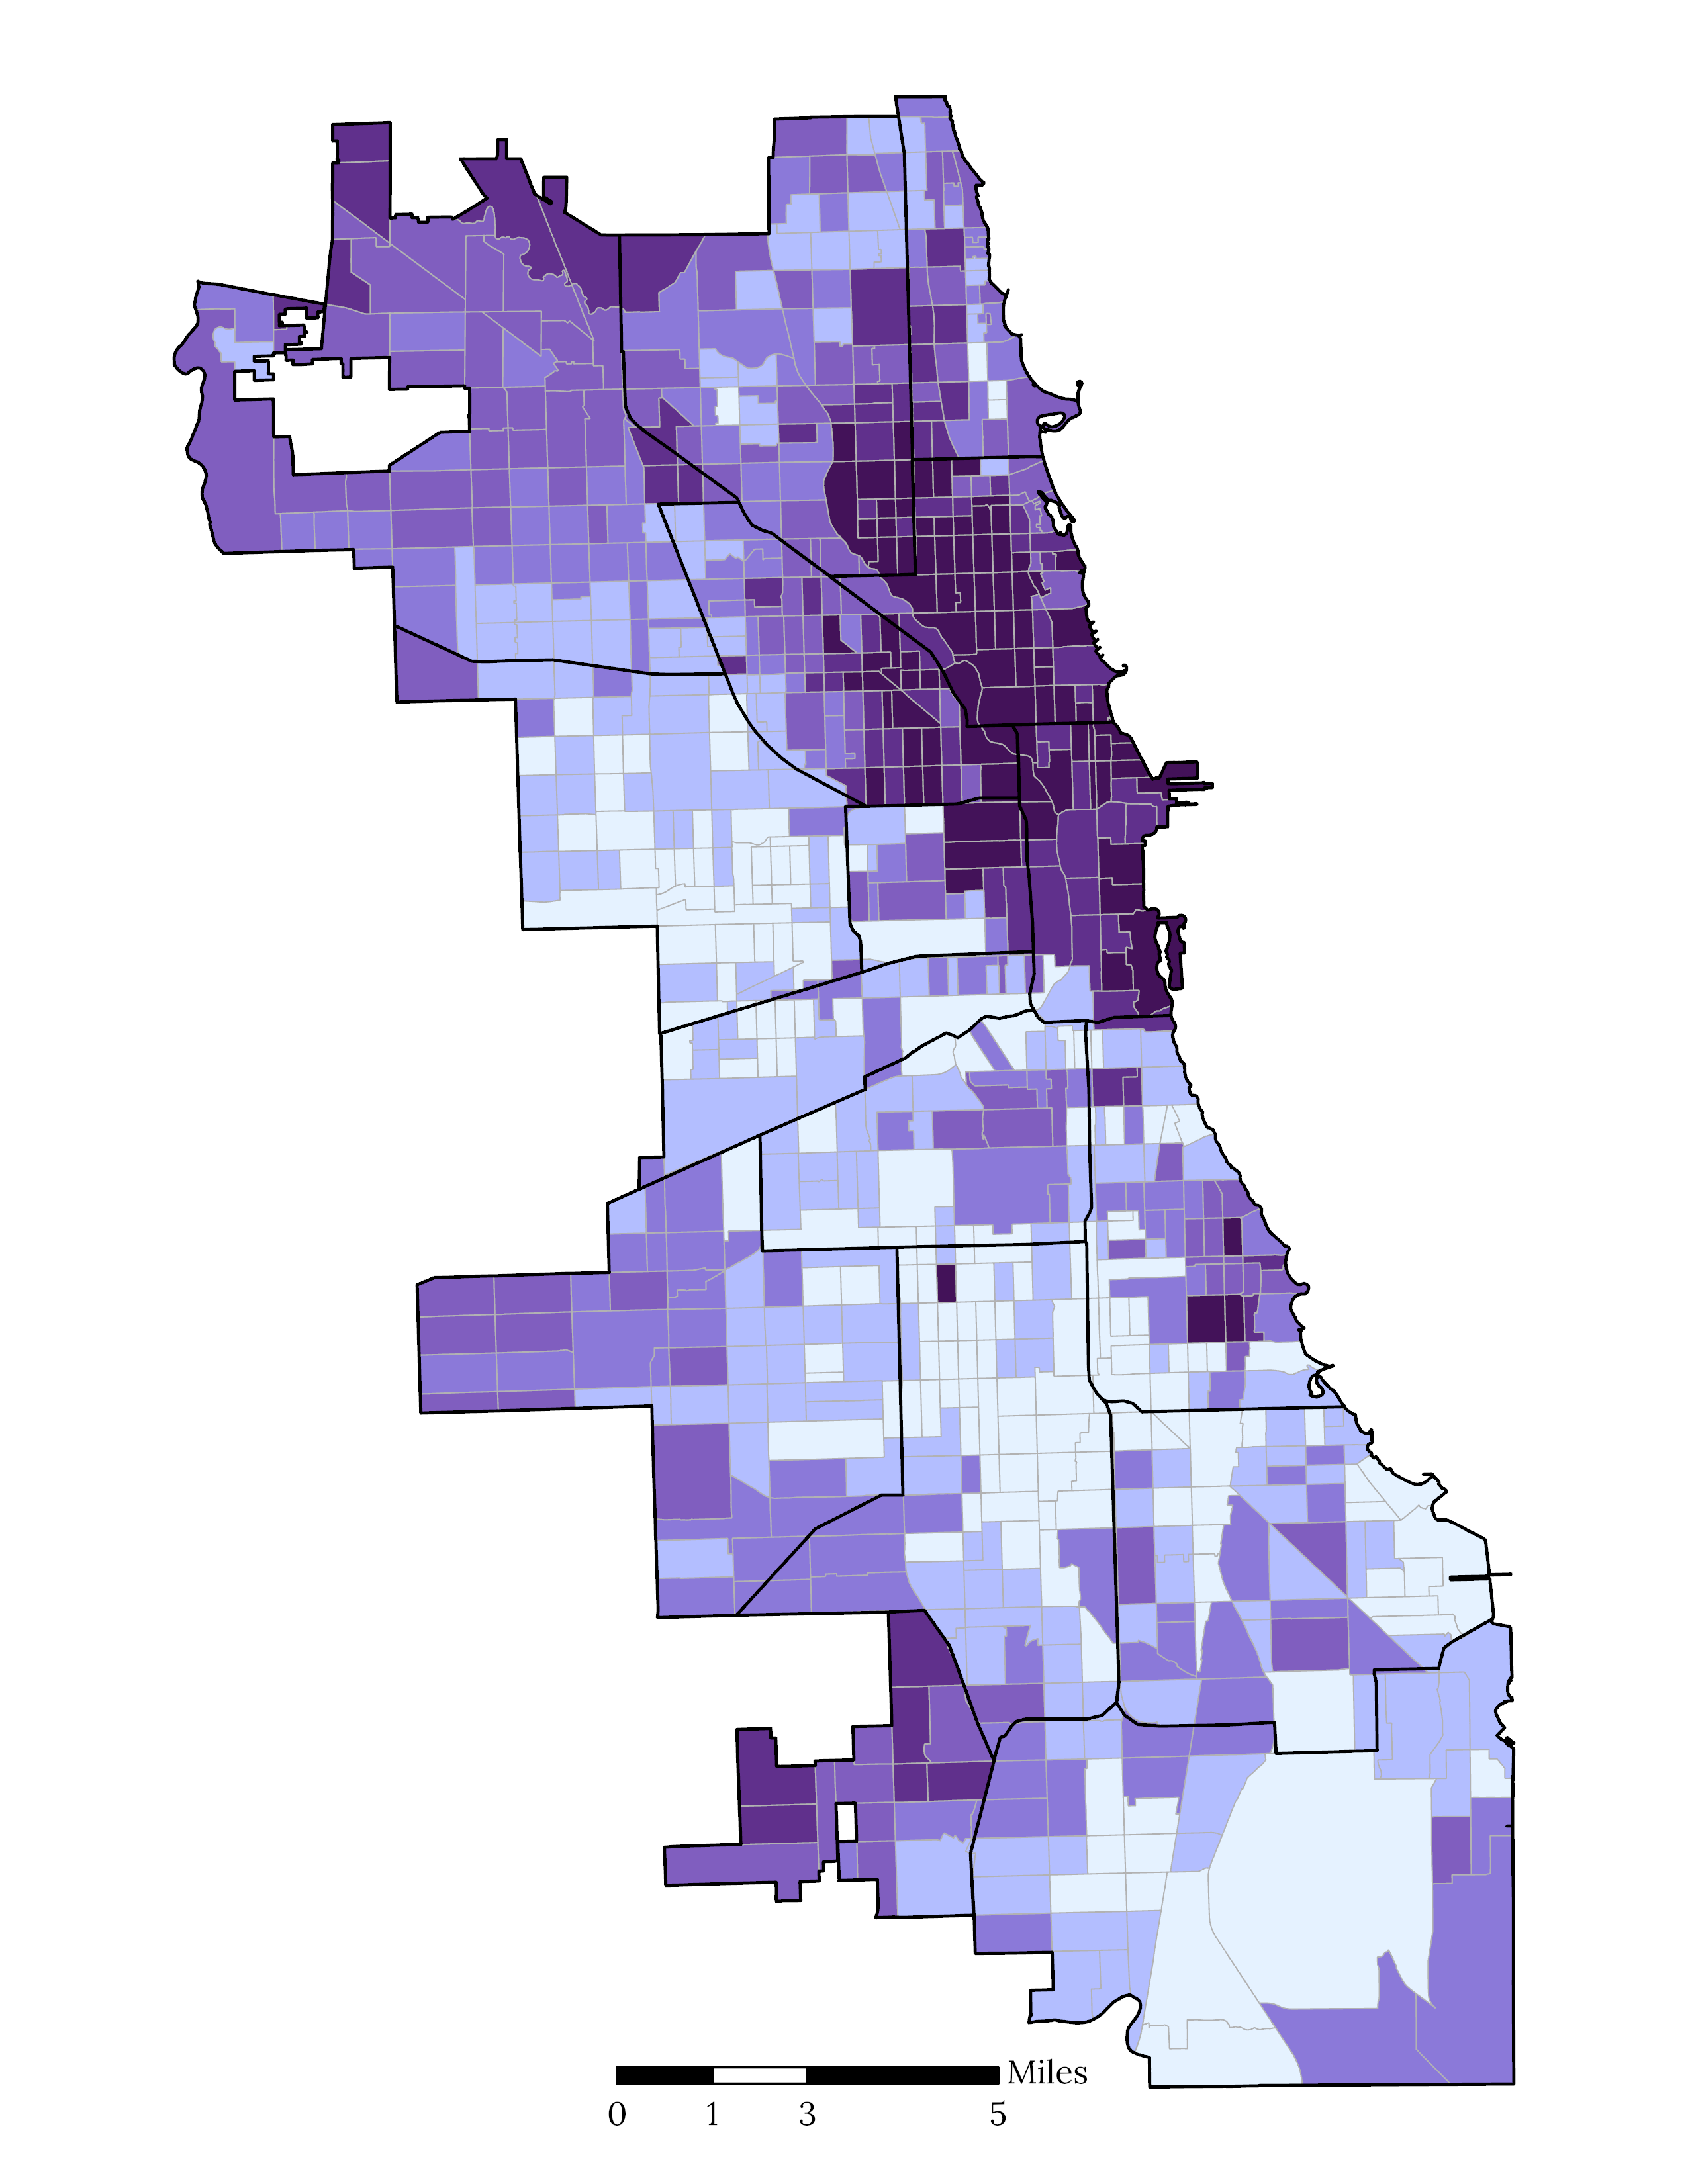
Race/Ethnicity Composition Map
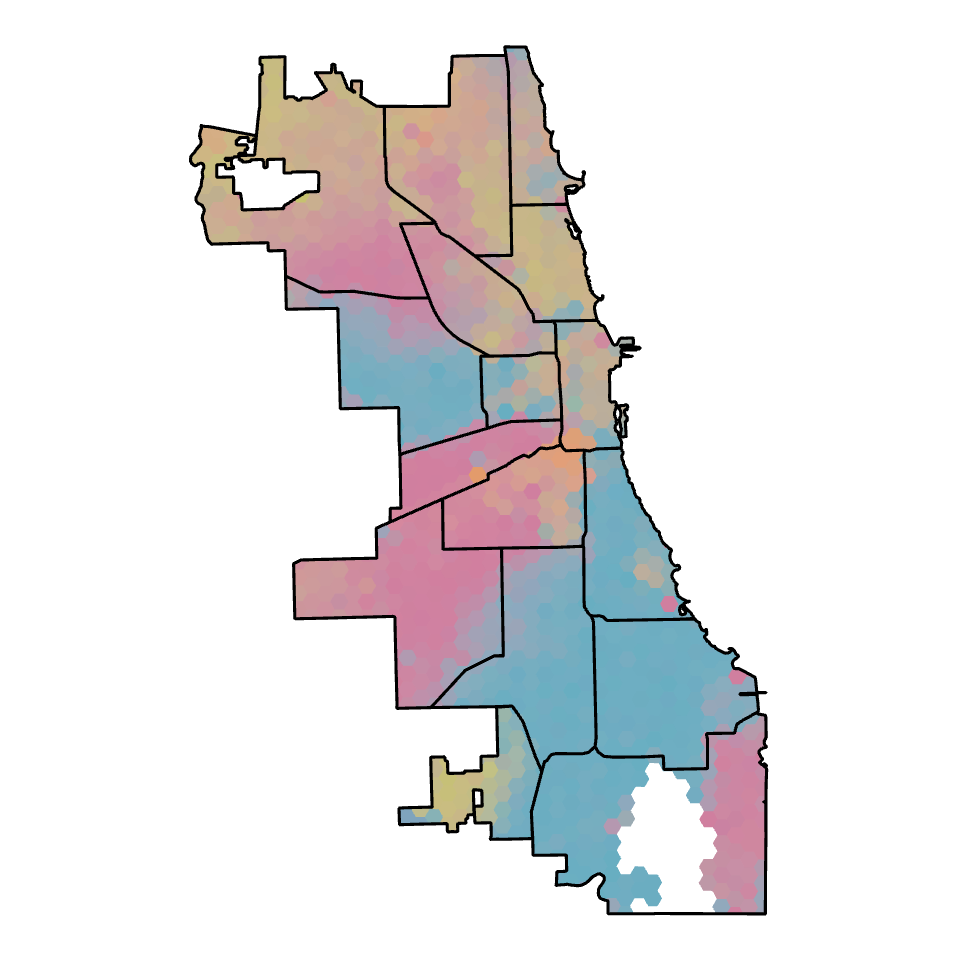
NOTE: This map combines the racial/ethnic identity of students who live in each area (hexagon) of the region. The design of this map protects individual student’s identities while displaying the distribution of race/ethnicity and student density in the region.
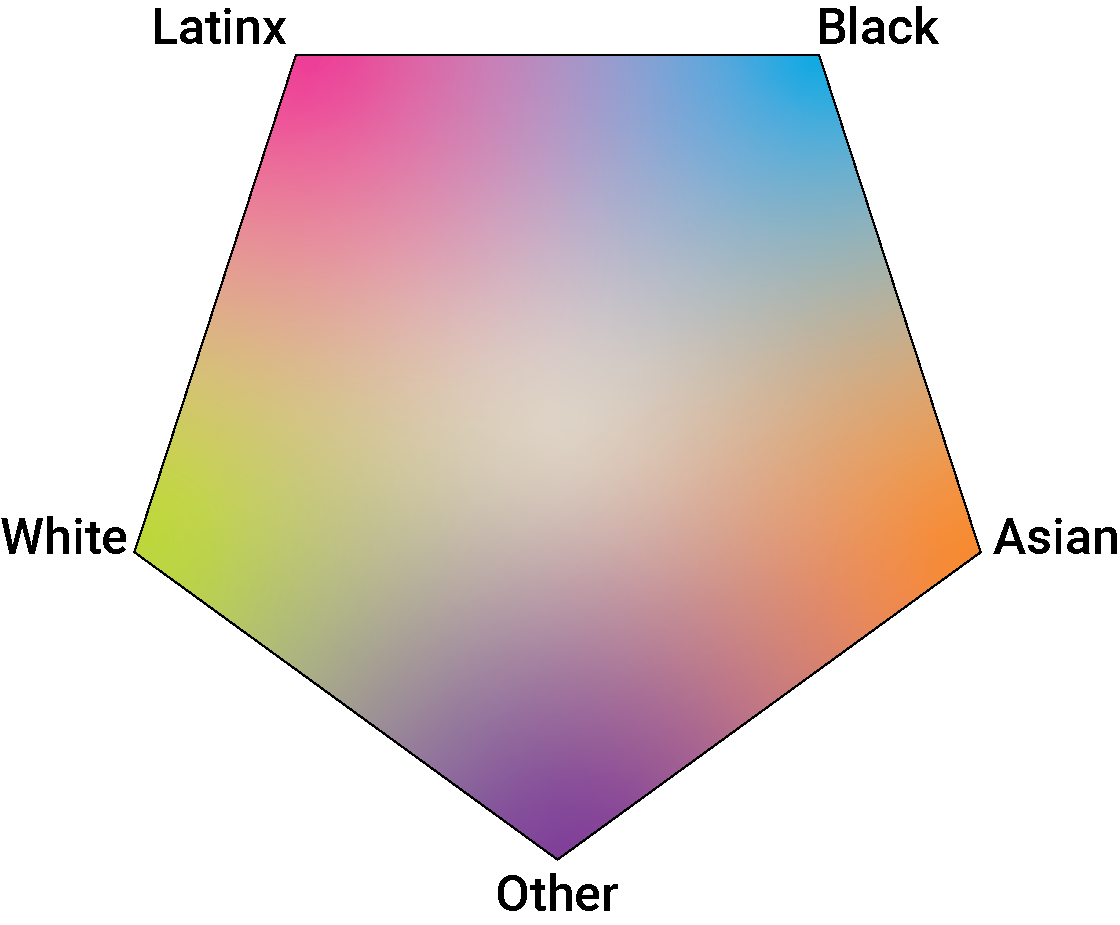
The legend shows how the colors associated with each racial/ethnic identity blend together. Areas (hexagons) that show more of one color than another have a higher density of that racial/ethnic identity. Areas with no distinct color are more diverse.
Free and Reduced Lunch Rates
Over the last four years, the percentage of students who qualify for free and reduced lunch (FRL) has increased with 71% of students currently qualifying.1, 2
Free and Reduced Lunch Rate Over Time
Free and Reduced Lunch Rate Over Time
MEDIAN HOUSEHOLD INCOME
1Before 2015, CPS relied on the Nutrition Services department to administer, communicate, and collect the FRL forms. When the federal lunch program was expanded to all students, CPS needed to administer a separate “Fee Waiver Form” that replaced the FRL form. As fee waivers continue to be collected throughout the school year, the percentage of qualifying students increases.
2FRL data is from the 20th day of each school year. Data from school years 2020-21 and 2021-22 was impacted in part by the COVID-19 global pandemic and the ability to administer and collect FRL forms during remote learning.
3The Median Household Income map combines the racial/ethnic identity of students who live in each area (hexagon) of the region. The design of this map protects individual student’s identities while displaying the distribution of race/ethnicity and student density in the region.
The legend shows how the colors associated with each racial/ethnic identity blend together. Areas (hexagons) that show more of one color than another have a higher density of that racial/ethnic identity. Areas with no distinct color are more diverse.
Enrollment Patterns
Historical Enrollment
CPS enrollment numbers include all students in grades Pre-K through 12th grade who are enrolled in the district on the 20th day of each school year. The projected enrollment numbers are created by the CPS Department of Planning and Data Management and are based on historical enrollment trends at each school.
| Since 2014-15, CPS total enrollment has decreased 19%.
| Over the next 3 years, there is a projected potential decrease ranging from 0% to 7%1.
Historical and Projected Student Enrollment
Historical District Enrollment
District Projection
Factors Impacting Enrollment
Broader citywide population trends indicate continued declining enrollment.
1) DECLINING BIRTHRATE
There has been a consistent decline in the number of births per year in Chicago leading to decreases in the childhood population in the city. The number of births affects CPS enrollment approximately five years later when children are expected to enter kindergarten.2
Births in Chicago Over Time
Births in Chicago Over Time
2) DECLINING CHILDHOOD POPULATION
The population of children ages 3 to 18 in Chicago is declining. This pattern is consistent for children enrolled in public or private schools. The “not enrolled” category includes any student between the ages of 3-18 who is not enrolled in a public or private school in Chicago. This includes 3- and 4-year-olds who are not in pre-school, 18-year-olds who are not enrolled in school, and students who are truant or have dropped out. This chart combines CPS enrollment data and U.S. Census Bureau data for the 2012-13 to 2021-22 school years.3
School-Aged Population Over Time
School-Aged Population Over Time
1Projections are preliminary and will be updated once data becomes available on the 20th day of the upcoming school year.
2Data source: Illinois Department of Public Health, dph.illinois.gov/data-statistics/vital-statistics/birth-statistics.html. Birth rate data from 2021 is the most recent year available.
3Data source: American Community Survey 5-year estimate census data, census.gov/programs-surveys/acs/microdata.html. School-aged population estimate data from 2022 is the most recent year available.